Summary
How many units per size to order depends on your product’s size curve, not an even split. A flat buy, equal units in every size, reliably manufactures dead stock, because core sizes like M and L typically account for 40%+ of sales while XS and XXL sell in single digits. This guide shows realistic size curves for menswear, womenswear, and unisex products, walks through a real $10,000 buy sheet at a 50-unit MOQ, and explains how to read early sell-through to size your first reorder.
The Buy Sheet That Bankrupts a Launch

Here’s how the most expensive early mistake in apparel actually happens. A founder builds their first buy sheet, opens a spreadsheet, and splits their unit count evenly across every size, because it feels fair, and because nobody told them it was wrong.
Six weeks later: S and M are gone. L is thinning out. XL and XXL haven’t moved. The cash that should be funding a reorder of the sizes actually selling is sitting in polybags nobody wants, and the founder is doing math on a markdown that erases the margin from everything that did sell.
This isn’t a demand-forecasting failure. It’s a size curve problem, and it’s completely avoidable once you understand that human bodies, and therefore garment sales, don’t distribute evenly across a size range. They cluster.
What a Size Curve Actually Is
A size curve (also called size distribution) is the expected or historical split of sales across the sizes in a style, expressed as a percentage of total units. It’s not a universal constant; it varies by category, by brand, and even by specific style within the same brand, but it is never flat, and treating it as flat is the single most common and most expensive mistake a first-time buyer makes.
Real sales data from t-shirt retailers illustrates the shape clearly: a distribution running roughly M 23%, L 20%, S 12%, XL 10%, XXL 4%, XS 2%, and XXXL 1%, with the remainder split across additional sizes. Notice what that means in practice: M and L alone account for over 40% of total sales, while the two smallest and two largest sizes combined barely clear 15%. A flat six-size split puts 16.7% of your budget in every size, wildly overbuying the tails and underbuying the core.
A commonly cited standard US curve for a six-size run looks like this: XS 5%, S 20%, M 35%, L 25%, XL 10%, XXL 5%. Different source, same shape, a pronounced peak in the middle sizes, tapering sharply at both ends.
Realistic Curves by Category
Size curves shift meaningfully by category and audience. Use these as directional starting points, not gospel; your own early sell-through data (covered below) should always override a generic curve once you have it.
Menswear (typical unisex-leaning fit, S–XXL): A men’s curve tends to skew slightly larger than a standard six-size distribution, often peaking at L rather than M, with a longer tail into XL and XXL than womenswear typically shows.
Womenswear (S–XL, fitted cuts): Womenswear frequently peaks at S or M depending on the brand’s target fit, with a steeper drop-off past L, though this varies enormously by brand positioning, and a size-inclusive brand will show a meaningfully flatter, wider curve than a fitted-fashion brand.
Unisex/oversized streetwear: Oversized and unisex-fit products tend to show the flattest curve of the three categories, because a boxy, relaxed fit accommodates a wider range of bodies at each labeled size; M and L often run close to even, with a genuinely usable tail into XL.
The takeaway that matters more than any specific percentage: your actual curve depends on your fit, your audience, and your marketing. A size-inclusive brand serving a broader range of bodies should expect, and plan for, a flatter, wider curve than a fitted fashion brand chasing a narrow aesthetic. Guessing wrong in either direction manufactures dead stock at the exact opposite end of the range from where you expected it.
The First-Range Formula: 2–3 Styles, 2 Colorways, One Hero
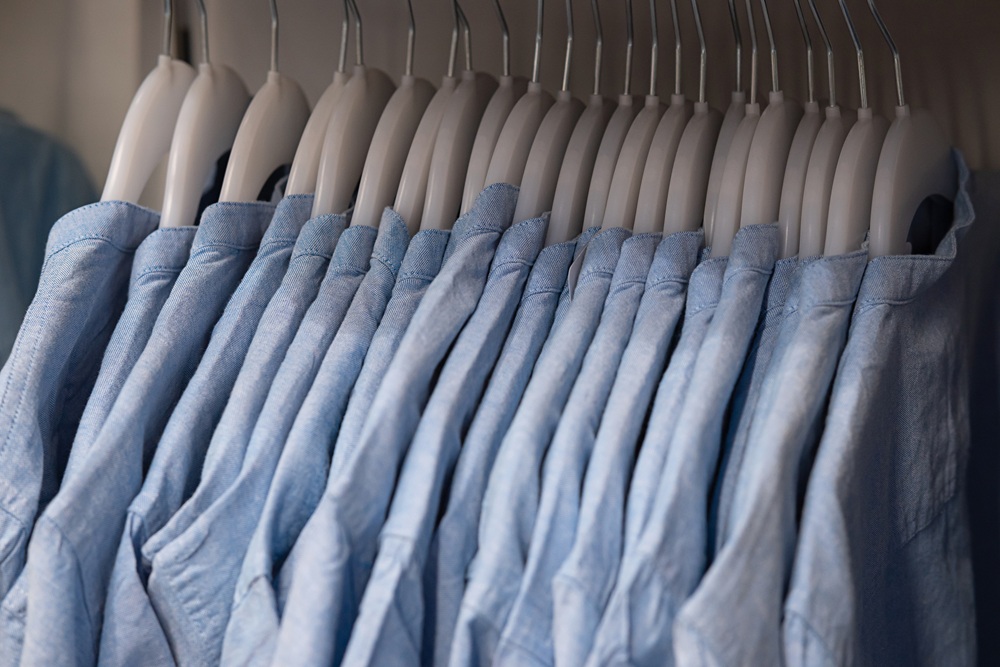
Before the size curve even enters the picture, the most common early mistake is overreaching on styles and colors before a single unit has sold.
Start with 2–3 styles maximum, each in 2 colorways, with one designated hero product. Here’s the reasoning: every additional colorway and style multiplies your total SKU count, and every SKU needs to independently clear your manufacturer’s MOQ. Spread a $10,000 budget across six styles in four colors each, and you’re not testing 24 product ideas, you’re hitting MOQ 24 times and diluting your budget so thin that no single item can be bought deep enough to actually learn anything from its sell-through.
A hero product, the one style you believe in most, likely to become your core item that reorders season after season, should receive the largest share of your budget and the deepest size run. Your remaining 1–2 styles are there to test the range around it, not to compete with it for capital.
This is precisely where a genuinely low MOQ manufacturer changes the math. At 50 units per color per design, testing 2–3 styles in 2 colorways each is financially realistic on a founder-scale budget. Try the same range plan against a 300-unit MOQ, and you’re forced to either abandon the range-testing approach entirely or commit far more capital than a first collection should ever require.
A Worked Buy Sheet: $10,000, 50-Unit MOQ
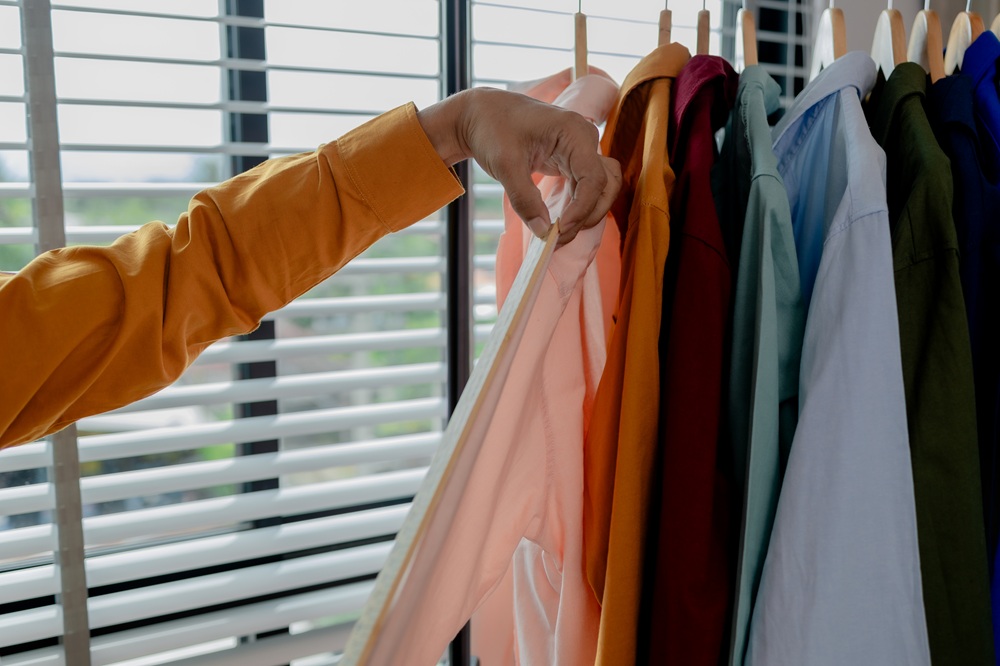
Let’s build a real range. Budget: $10,000. Manufacturer MOQ: 50 units per color, per design. One hero hoodie and one supporting tee, both in 2 colorways.
Hero product: Hoodie, 2 colorways, unit cost 22→250unitstotal (5,500)
Applying a menswear-leaning curve (XS 3%, S 17%, M 33%, L 28%, XL 14%, XXL 5%) to a 125-unit-per-colour buy:
Size |
% of Curve |
Units per Colorway |
Total (2 Colorways) |
| XS | 3% | 4 | 8 |
| S | 17% | 21 | 42 |
| M | 33% | 41 | 82 |
| L | 28% | 35 | 70 |
| XL | 14% | 18 | 36 |
| XXL | 5% | 6 | 12 |
| Total | 100% | 125 | 250 |
Supporting product: Tee, 2 colorways, unit cost 9→250unitstotal (2,250)
Using the same curve shape, sized to the same 125-per-colourway total, follows the identical proportional split above.
Remaining budget: ~$2,250, held back deliberately, not spent. This is your reorder fund, ready to move the moment sell-through data tells you which size and color combination is actually working. Spending every dollar on the first buy leaves nothing to react to, which defeats the entire purpose of buying to a curve in the first place.
Notice what this buy sheet does not do: it doesn’t order equal units in every size. It puts the deepest inventory in M and L, a meaningful but smaller amount in S and XL, and the thinnest coverage at XS and XXL, present enough to serve those customers and gather real data, not so deep that a miss there sinks the whole range.
Reading Sell-Through to Size Your Reorder
Sell-through rate, units sold divided by units received over a given period, is the single number that should override any curve you started with. The first 2–4 weeks of real sales data are worth more than any industry benchmark, because they reflect your actual customers, not an average.
What to watch for:
- A size selling out faster than its curve share predicted; if M was allocated 33% of units but is generating 45% of sales, your next buy should shift weight toward M, not just repeat the same curve.
- A size barely moving despite reasonable stock could be a genuine demand signal, or it could be a fit or grading issue worth investigating before you conclude nobody wants that size.
- Returns concentrated in one size, a high return rate in a specific size, often signals a fit problem, not a demand problem. Don’t read it as “this size doesn’t sell”; read it as “this size doesn’t fit as intended,” and fix the pattern before the next buy, not just the quantity.
This is your open-to-buy moment, the budget you’ve deliberately held back, ready to commit once the data tells you where. A reorder built on four weeks of real sell-through will consistently outperform a repeat of your original guess, because it’s no longer a guess.
Core vs. Seasonal: Not Every Style Gets the Same Treatment

As your range grows past the first collection, distinguish between core styles, proven sellers you reorder repeatedly, ideally on a locked size curve refined by real data, and seasonal styles, which carry more forecasting risk and deserve a more conservative, test-sized initial buy.
Your hero product, once validated, graduates to core status: deeper buys, a size curve worth trusting because it’s been tested, and priority for your reorder budget. New styles stay in test mode, smaller, curve-informed but conservative buys, until they’ve earned the right to scale.
If you’re planning multiple seasons ahead, this same discipline applies whether you’re buying under your own label or exploring private label products; the size curve math doesn’t change based on whose name is on the tag.
Avoiding Dead Stock and the Markdown Spiral
Dead stock, inventory that isn’t selling and probably won’t at full price, is the direct, predictable output of a flat buy. Once it accumulates, the only real options are a markdown (which erodes the margin you earned on everything that did sell) or writing it off entirely.
The size curve approach doesn’t eliminate dead stock risk completely; no forecasting method does, but it concentrates your risk in the sizes where getting it wrong costs the least and puts your deepest inventory where demand is most reliably concentrated. That’s the entire game: not perfect prediction, but intelligently weighted risk.
Inventory turn, how many times your stock sells through and gets replaced in a given period, is the metric that ultimately tells you whether your curve is working. A size-curved buy with a healthy reorder cadence turns faster than a flat buy sitting on unsold tails, and a faster turn means more of your capital is actively working rather than parked on a shelf.
Build the Curve Before You Build the Buy Sheet
The founders who avoid the dead-stock trap aren’t the ones with perfect demand forecasting. They’re the ones who understood, before placing a single order, that sizes don’t sell evenly, and built a buy sheet that reflected that from day one, then let real sell-through refine it from there.
Start with 2–3 styles, 2 colorways, and one hero. Apply a realistic curve, not a flat split. Hold back the reorder budget on purpose. And choose a manufacturer whose MOQ makes testing that range financially sane in the first place, which is exactly what a clothing line business plan built around low-MOQ testing should account for from the start.
Ready to build a first range sized the right way? Talk to Weft Apparel about a low-MOQ collection built around a real-size curve, not a guess.
Frequently Asked Questions
How many units per size should I order?
Base it on a size curve rather than an even split; core sizes like M and L typically account for 40% or more of total sales, while the smallest and largest sizes combined often represent under 15%. Apply a realistic curve for your category, then let your first 2–4 weeks of sell-through refine future buys.
What is a size curve in apparel?
A size curve is the expected or historical distribution of sales across the sizes offered in a style, expressed as a percentage of total units. It’s never flat; sales cluster around core sizes and taper at the extremes, and the exact shape varies by category, fit, and target audience.
How many styles should my first collection have?
2–3 styles in 2 colorways each, with one designated hero product receiving the largest share of the budget, is a sound starting formula. Spreading a limited budget across more styles and colors risks hitting MOQ repeatedly while diluting each item too thin to generate meaningful sell-through data.
How much inventory should a new clothing brand buy?
Size the total buy to your available budget, but hold back roughly 20–25% as a reorder fund rather than spending everything on the first order. That reserve lets you react to real sell-through data within the first few weeks, rather than being fully committed to a guess with no capital left to correct it.
How do I avoid dead stock?
Buy a realistic size curve instead of an even split, keep your first range narrow (2–3 styles, 2 colorways) so each SKU can be bought deep enough to generate real data, and hold back the reorder budget so you can react to actual sell-through rather than guessing twice in a row.